This article will explain how to plot an estimated position. Whenever we are sailing or motor boating on the ocean we need to keep a record of our navigational passage. There are many reasons for this. Commercial vessels and vessels over a certain size are required by law under the SOLAS V rules to maintain a navigational record.
You can find the SOLAS requirements here in REGULATION 28.
As skippers or captains we need to ensure we keep a record of our progress on a passage so that we can monitor our journey against the navigational plan. An estimated position is one of the navigational tools we have in order to do this.
What is an estimated position?
When we are on a passage we know how fast we are moving through the water. The information is given to us by the ships log. The log is basically a paddle wheel that records distance travelled. A bit like the odometer on a car.
We also know what our heading is. We either get this information from the GPS chart plotter or from the magnetic compass. If we were to plot this information onto a chart we could see the heading and distance travelled from a known starting point.
However, when we are sailing or motor boating in tidal waters, this plot would be very inaccurate. This is because it takes no account of what the tidal flow and current would have done to our boat. Nor does the plot take into account the effect of the wind, known as leeway. An estimated position takes all of these factors into account. The heading, distance travelled and the tidal direction and speed and the leeway.
Why do we plot an estimate?
There are many accurate ways of establishing where we are on the sea. These include things such as three point fixes or transits. On longer passages however, we may not be in sight of charted objects that we could use to gain a more exact position. We may not be in sight of land at all. That’s when we need this tool to estimate where we are.
How to plot the position
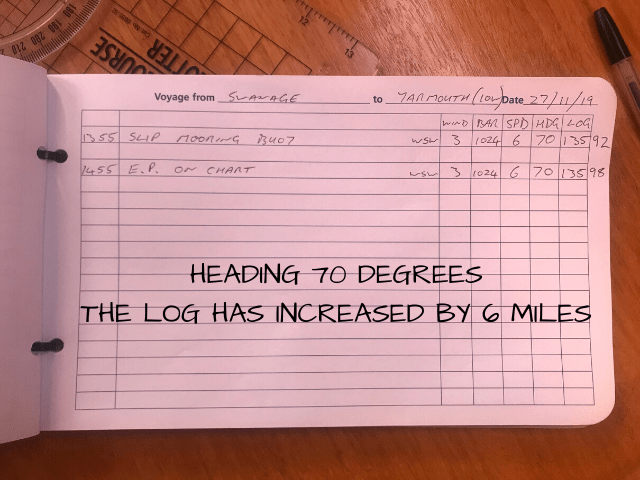
Take a look at the skippers logbook entry for a journey from Swanage Bay to the Isle of Wight.
In the following example we are going to plot the estimated position of this yacht that has left an anchorage in Swanage Bay and is making it’s way across Poole Bay towards the Isle of Wight.
The date of this voyage is the 27th of November 2019 as we can see from the log entry. We will be using Reeds Nautical almanac for tide data and the Imray charts for plotting and the tidal diamonds for the current direction and speed.
Step 1: Start with what we know
The first thing we can do is plot our start point on the chart. This should be best practice while monitoring progress on a passage.
We can also plot our heading and distance travelled. It makes the process easier if this is done for either half an hour or an hour. We can see from the log entry that the vessel has left Swanage and has travelled on a heading of approximately 70 degrees for an hour. It’s speed through the water during this time was 6 knots.

Step 2: Allow for wind
If the wind is on our beam it will have the effect of pushing the boat sideways. We can estimate the effect of this and alter our plotted heading accordingly. It’s easiest to allow this change in 5 degree increments.
As an example, a northerly wind (coming from the north) will push the vessel south. We call the effect of the wind leeway. We can alter the plot on the chart to allow for this effect.
You can use a simple trick to remember this. If the wind is on the Port side then the compass heading will increase. ‘P’ for port and ‘P’ for plus.
If the wind is on the starboard side then the compass heading will decrease. ‘S’ for starboard and ‘S’ for subtract.

From the logbook we can see that the wind is coming from the West South West. As it’s pretty much from behind the vessel there is no leeway to allow for.
Step 3: Allow for the tide
After we have plotted our heading and journey distance on the chart we have to plot the tidal vector on the end. This will show us what the current has done to our vessels journey over the time we have been travelling.
For this example we are going to use tidal diamond ‘h’ as this is the one that’s closest to our water track on the chart.
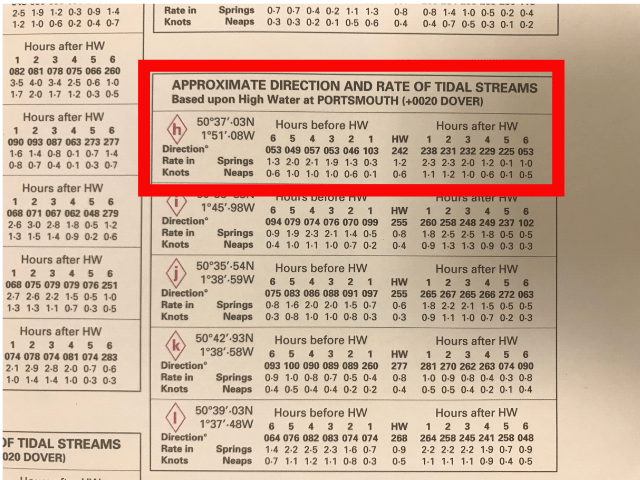
We can see from the tidal diamond information that the data is based on high water at Portsmouth. So we first need to check the high water time at Portsmouth using the tide tables. We would refer to Portsmouth as the ‘standard port’.
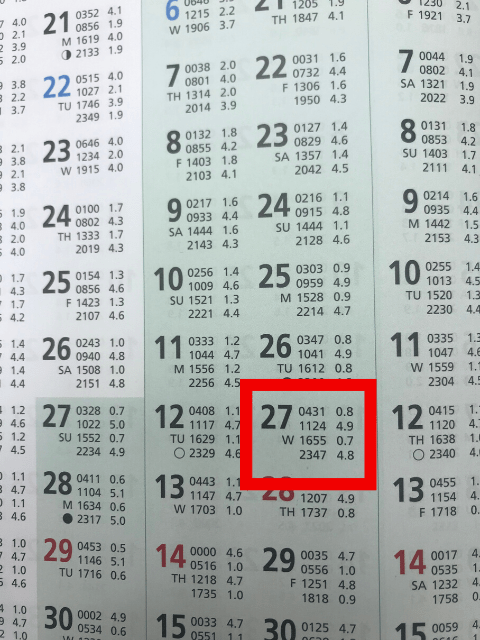
We know from our log entry that the date is the 27th of November and we can see from the Portsmouth tide table that the time of high water is 1124.
The table also shows us that we are in springs. We need to know this in order to use the correct tidal speed. This is called the ‘rate in knots’ and it refers to the speed of the current.
We now need to work out which tidal hour we are in so we can plot the correct tidal diamond information. The log book tells us that we left the mooring buoy in Swanage at 1355 and travelled for one hour.
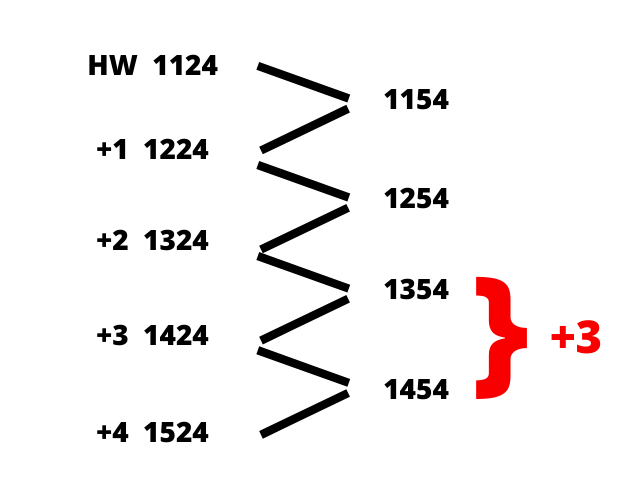
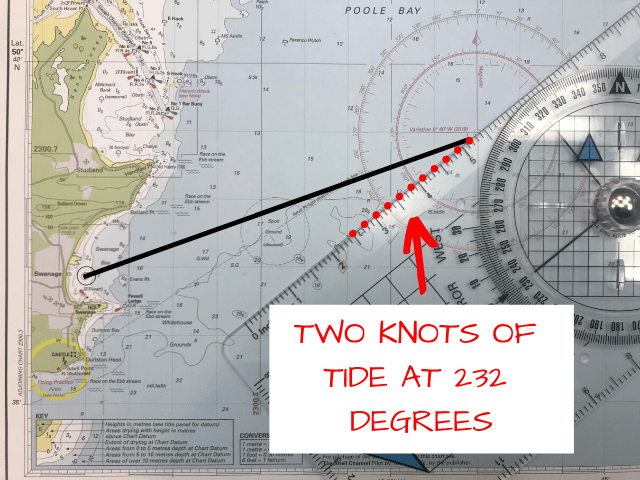
Using a tidal hour ladder to ensure we get the correct tidal hour, we can see that we are in HW +3 hours. Referring back to the tidal diamond ‘h’ information we can now read the correct data. During our journey the tide went at a rate of 2.0 knots on a heading of 232 degrees.
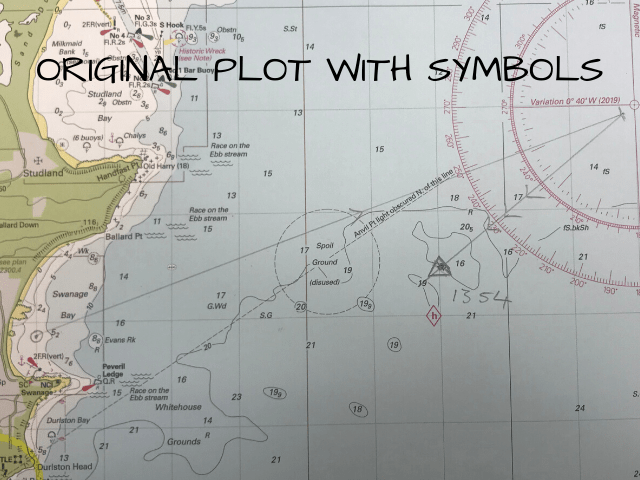
We now plot the tidal vector on the end of our journey using this information.
The final point at the end of the tidal vector is our estimated position. This is where we are likely to be after allowing for the effects of the wind and tide. This point is marked by a triangle and it is good practice to note the time of the fix on the chart as well as in the log.
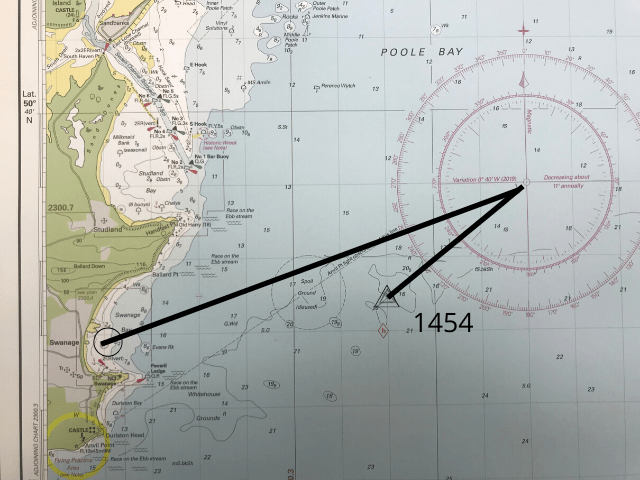
On this particular journey the tide has pushed the yacht backwards and the skipper would have done well to plan a more convenient start time. one during which the tide was with the vessel.
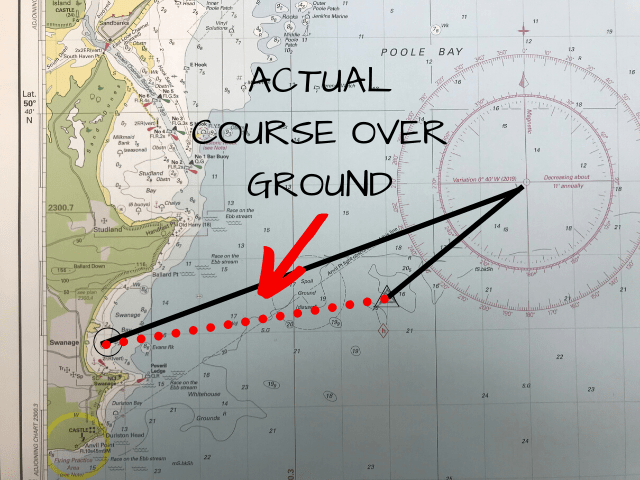
The course over ground that the boat has actually taken is shown by the red dotted line below.
AREA OF UNCERTAINTY
It’s important to remember that this method of navigation is an estimate. If possible we should use more accurate methods of traditional and electronic navigation.
As this method is an estimate we can’t be certain that it is exactly correct. As that is the case, you will want to allow an area of uncertainty. This area can be measured as between 5% or 10% of the journey distance.
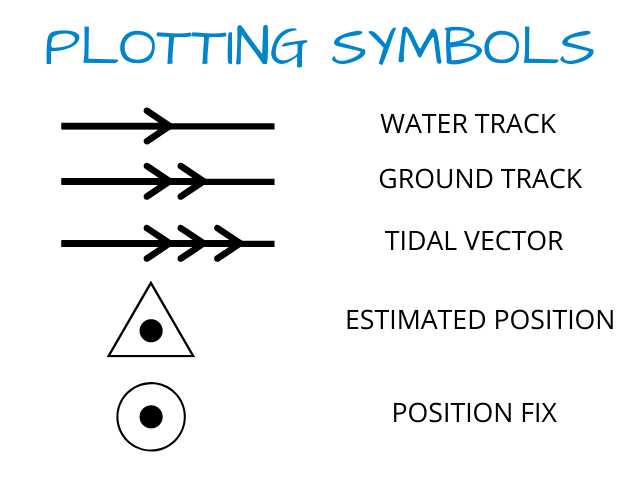
PLOTTING SYMBOLS
It is important to use recognised plotting symbols when you are doing your chart work. This is so you can trace back over your work if needs be. It also allows the next sailor who is on watch to understand what you have done. That means they won’t have to wake you up!
Take a look at the plotting symbols below that are used for an estimated position.
Check Out The Walk Through YouTube Video
Click the link below to subscribe to our channel to get all our videos as we publish them
Free Estimated Position Cheat Sheet
As always we have created you a comprehensive cheat sheet that you can get by clicking on the image below. It will give you a thorough walk through guide on how to plot an estimated position.

Our complete set of Knowledge Cards are available from our shop
-
 Skippers Knowledge Cards£19.99