This article and video will explain to you what a tidal curve is. It will also guide you through how to use tidal curves. You can then predict the height of the water in the relevant area. Which is really important if we want to avoid running aground.
So what are tidal curves?
Tidal curves are graphs that show us how water behaves as the tide comes in and goes out again. Take a look at this one:
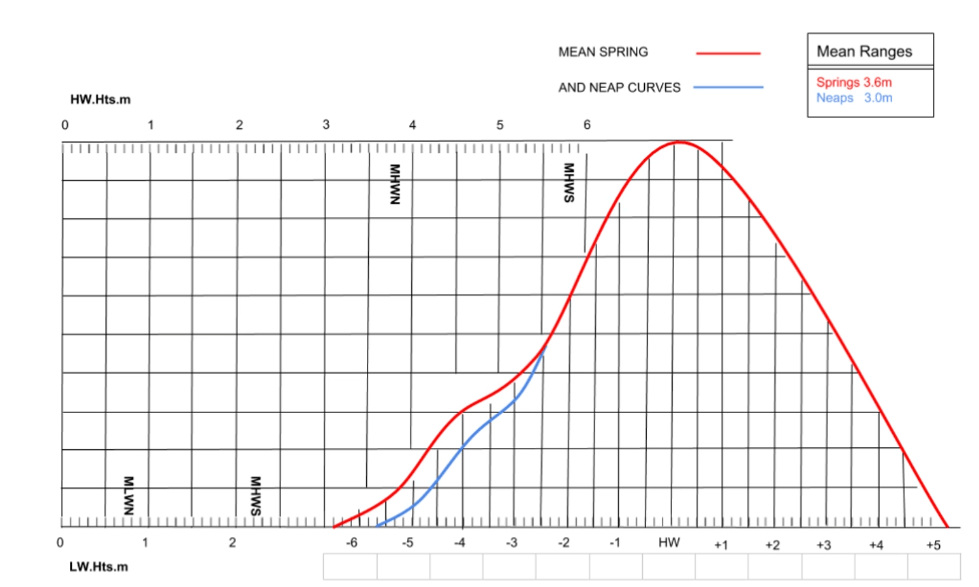
Although it looks intimidating at first, it’s actually very simple to use. The Boffins over at the Hydro-graphic Office have done all the clever work for us. They have worked out how quickly and evenly the water goes in and out, done some maths so we don’t have to, and given us a red and a blue line so we can visualise what’s going on.
So what does the red line show?
Following it from the left hand end the red line starts at low water. Then it shows the tide coming in slowly to roughly half way when it speeds up until it reaches high water. High water is depicted at the top of the curve. From this high water point the tide goes out evenly and quickly until it reaches the next low water. This second low water is depicted at the right hand end of the red line. This is how the water behaves on a Spring Tide.
So what about the blue line?
The blue line shows the same thing as the red line except this is how the tide behaves during a neap tide. You can see that there is a slight difference in the water’s behaviour as the tide starts to come in. After that, a neap tide behaves in the same way as a spring tide. So it just joins in with the red line. The spring line.
If you want a refresher on the difference between spring and neap tides, check out this tidal definitions video.
So what about the rest of the graph?
There are three other parts to the graph that we need to know about in order to be able to predict the tide.
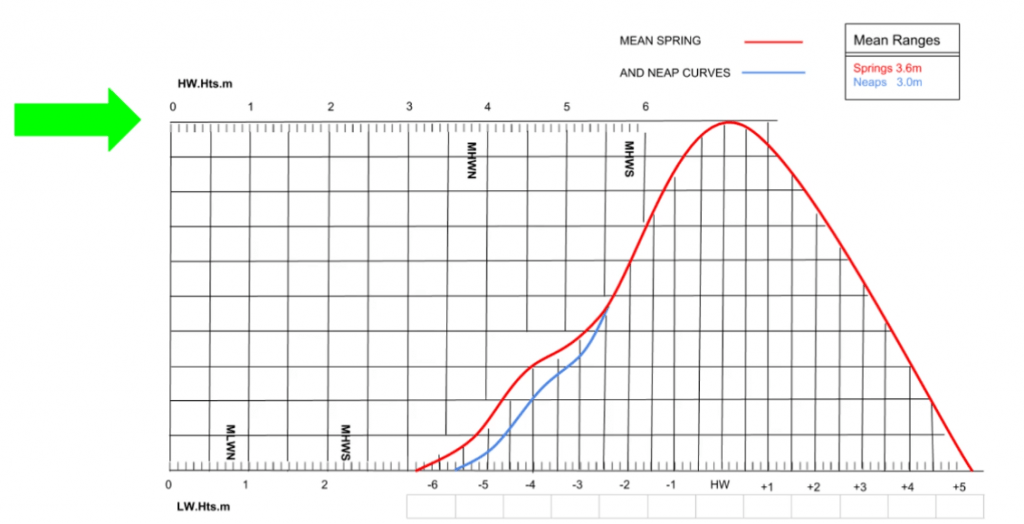
The scale at the top of the graph is labelled HW.Hts.m. This is where we enter the High Water Heights in metres. This changes every day and we can find it in the tide tables. We have to enter the high water value on this top scale.
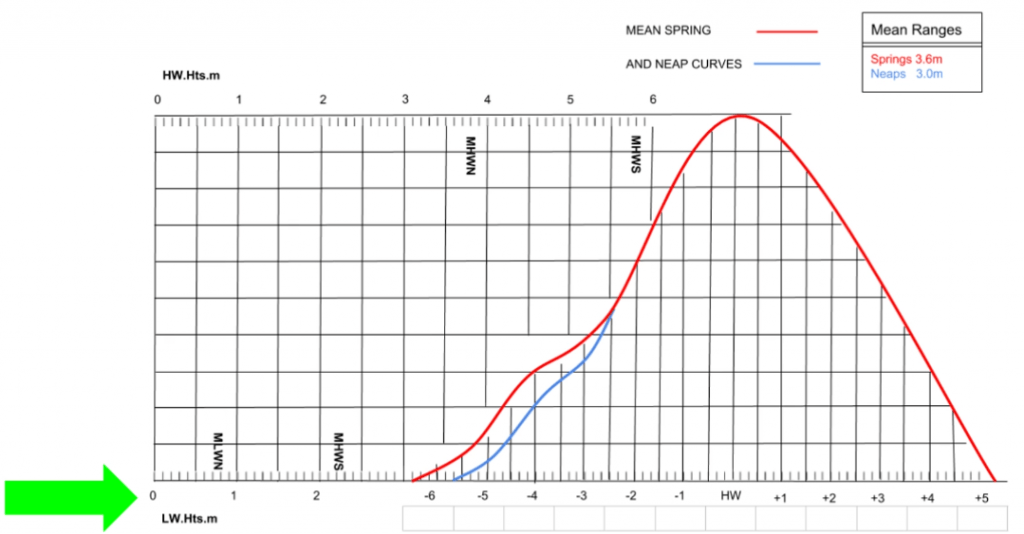
The scale at the bottom of the graph is labelled LW.Hts.m. This is where we enter the height of low water. By using both the high water scale and the low water scale we are able to apply a range of tide to the curve. In other words we can apply measurements to the behaviour of the water.
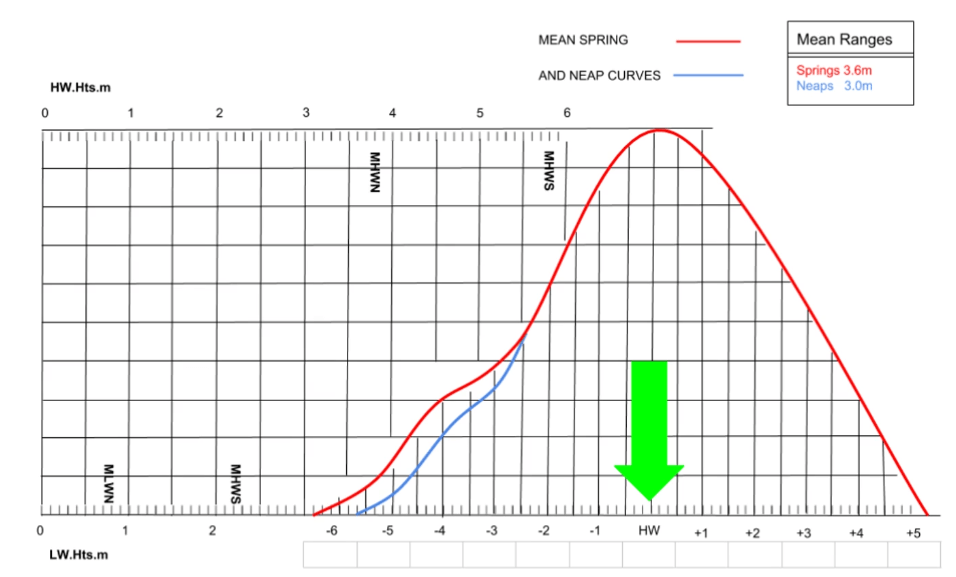
Finally, the boxes underneath the tidal curve are where we can fill in the time of day. So we can then apply an accurate time to the behaviour of the water as well as the measurements.
How to use tidal curves
Watch this video so that you can see a live example of a couple of ways these tidal curves can be useful. While you’re at it, why not subscribe to the YouTube channel as well. ?


