
How to do them – a walk-through video and a free handy template
Secondary port calculations are something that people always find tricky. I think it’s because it looks like a mathematical problem but it’s really just looking up information from the almanac. Hopefully, this useful “How to” guide and our template will clear the whole thing up for you. Do feel free to share this post and leave any comments if you find it useful ???
So what are secondary ports?
It’s not practical for publishers of tide times to issue calculations for absolutely everywhere for the entire year. The size of the book would be ridiculous. Instead, publishers only issue tide times and heights for standard ports. Secondary ports are minor ports in proximity to a standard port. It is possible to make some simple adjustments to the data of a standard port so that we can work out what is going on in the secondary ports.
We can then use this newly calculated information to fill out the standard ports tidal curve. We then have our curve for the day set up for the secondary port.
Where do we find the data we need?
The data we need can be found in almanacs and pilot books. Let’s look at an example from an old volume of Reeds Nautical Almanac.
You can buy a copy direct from the publisher by following this link: https://www.bloomsbury.com/uk/special-interest/nautical/reeds-nautical-almanacs/
https://www.bloomsbury.com/uk/special-interest/nautical/reeds-nautical-almanacs/
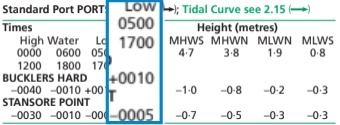
We will use a place in the Solent called Stansore Point which is in the Beaulieu River. Here’s what the data says:
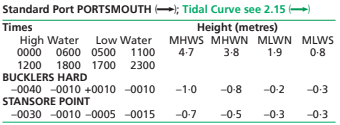
The title at the top of the block of information tells us that the standard port everything relates to is Portsmouth. It even gives us a little arrow to show us which way to turn the pages to find the standard port and its tidal curve.
Let’s go through the information column by column and make sure we understand what it means. The first four columns are to do with time and how it relates to the standard port.

This first column then, tells us that if HW at the standard port (Portsmouth) is at midnight or at midday, then HW in Stansore Point will occur 30 minutes earlier, at 23:30 or 11:30.

The second column, still relating to HW time, states that if HW at the standard port (Portsmouth) is at 6am or 6pm, then HW in Stansore Point will occur 10 minutes earlier, at 05:50 or 17:50.
The next two columns relate to time differences at LW. If LW at Portsmouth is 5am or 5pm, then LW at Stansore Point will occur 5 minutes earlier.

Or if LW at Portsmouth is 11am or 11pm, then LW at Stansore Point will be 15 minutes earlier.
After those first half columns that relate to times of HW and LW, the next half are all to do with heights. The first to are relevant to HW height.

If HW portsmouth is 4.7 metres then it would be 0.7 metres less at Stansore Point. Or 4.0 metres.

If HW portsmouth is 3.8 metres then it would be 0.5 metres less at Stansore Point. Or 3.3 metres.
The final two columns are LW heights.

If LW Portmouth is 1.9 metres then we will have 1.6 metres at Stansore Point. Whereas if LW is 0.8 metres, we will only have 0.5 metres at Stansore Point.

How do we relate this data between the Standard and Secondary Ports?
Here is a random day of information from the Portsmouth tide table (the standard port)

We will make adjustments to the middle if the day as we can assume we are visiting Stansore Point for lunch. Therefore, LW at the standard port (Portsmouth) is at 11:21am with a height of 1.8 metres and HW is at 18:19 in the evening with a height of 3.9 metres.
We need three pieces of information in order to fill out a tidal curve. Let’s remind ourselves what they are by looking at the Portsmouth curve.
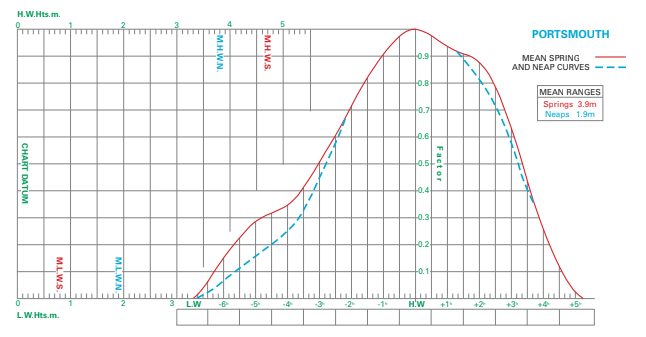
We need a HW height for the top scale, a LW height for the bottom scale and a HW time for the boxes at the bottom.
So now we need to apply the differences from the table to what is happening at the standard port.
Click the secondary ports link below to get our template to download and print off. You will need it to be able to follow along with the explanation.
Watch this video for a walk through guide. We will show you step by step how to use the template and how to work out secondary port calculations.
I was really struggling to grasp secondary ports and this video really helped, being able to study at my own pace, rewinding the video and work along with it helped me gain a thorough understanding and be confident in my working out. It’s clear and concise.
I would thoroughly recommend Noel to anyone looking to study up to Yachtmaster level, below, or above! I’ve just completed my yachtmaster offshore theory course with him and it’s been very rewarding. Great instructor. There’s also other instructional videos on this website which i’ve found really handy!
Really clear explanation of secondary port calculations and how to extract the info from the almanac to produce a tidal curve. I found this a great refresh, its just over a year since I completed my day skipper theory. Keep up the good work Noel!